Project Overview
This project explores student performance using a comprehensive educational dataset covering assessment scores, pass rates, final grades, and subject-level academic outcomes. The goal is to uncover learning trends, identify top performers, detect performance gaps, and highlight areas needing academic intervention. The interactive dashboard will help educators and administrators understand achievement patterns, monitor academic progress, and make data-driven decisions to improve student outcomes.
Dashboard Views
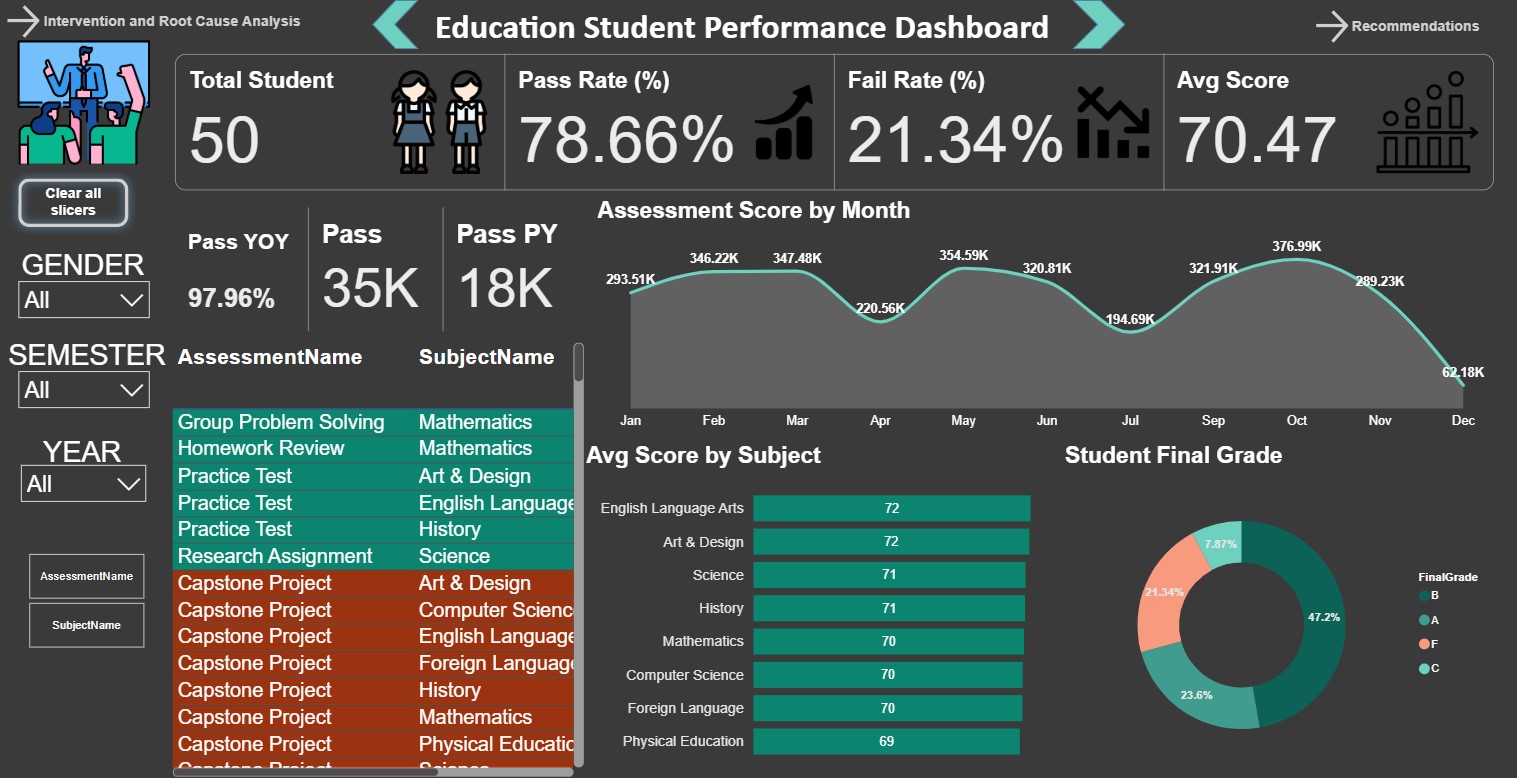
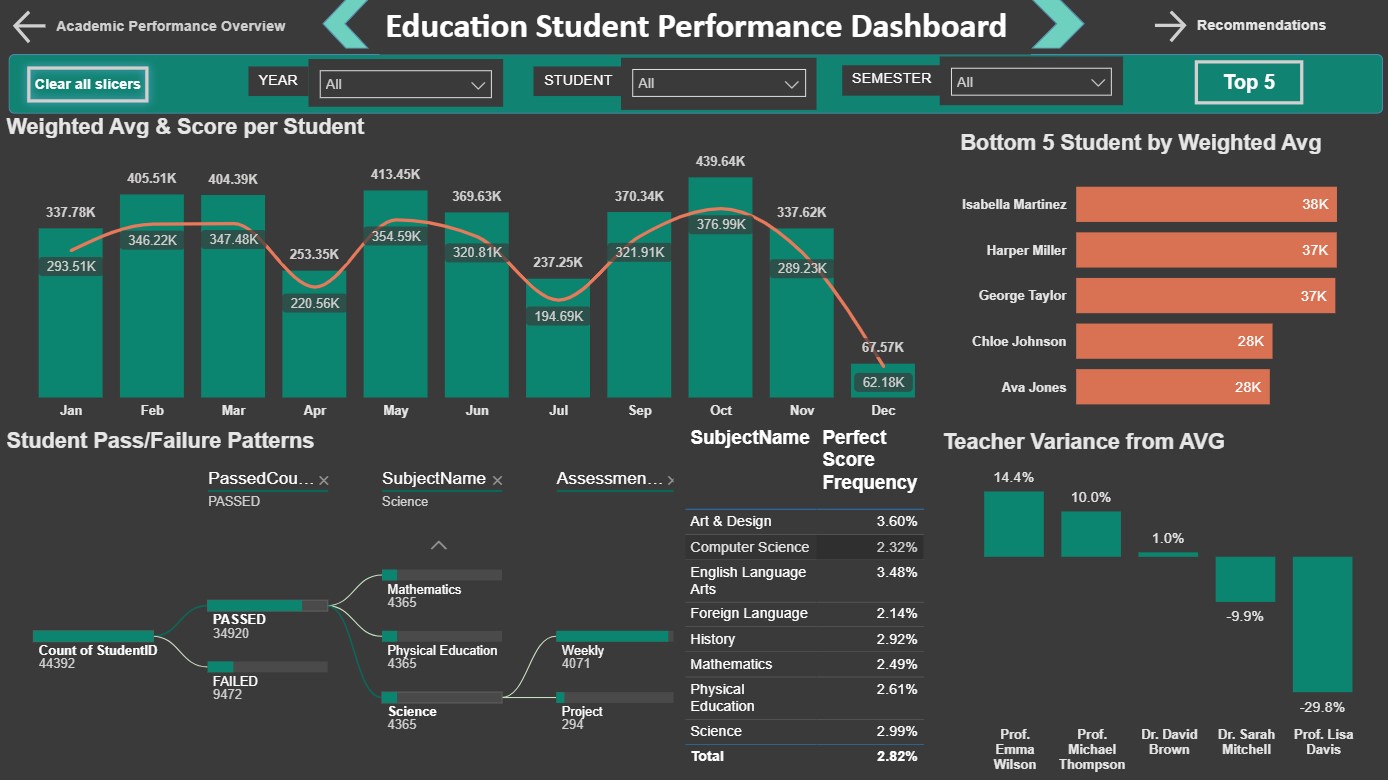
Performance Summary
| Metric | Insight |
|---|---|
| Overall Pass Rate | 78.66%, YoY pass rate +97.96%, average score 70.47 |
| Monthly Performance Trend | Dips in April, July, and December |
| Highest Average Subjects | English Language Arts (72), Art & Design (72), Science (71) |
| Lowest Average Subject | Physical Education (69) |
| Perfect Score Frequency | 2.82%; highest in Art & Design, lowest in Foreign Language |
| Teacher Effectiveness | Prof. Lisa Davis –29.8% below average; Prof. Emma Wilson +14.4% above average |
| Fail Patterns | 21.34% failed assessments, concentrated in Math, PE, Science |
| Top vs Bottom Students | Top: 38k–44k weighted average; Bottom: 28k weighted average |
Top 5 High-Impact Recommendations
- Fix Low-Performing Subjects Focus on PE, Math, and Science to improve student outcomes.
- Support Underperforming Teachers Provide mentorship and training, especially for Prof. Lisa Davis.
- Target Score Dips Implement interventions in April, July, and December.
- Increase Perfect Scores Adjust curriculum to encourage higher achievement.
- Early Warning Signals Track struggling students and provide timely interventions.